


For details, see How to Use.
GraphFileAnimator3D - 3D Graph Plotting Tool for Animating Data Loaded from Multiple Files
This VCSSL program is a simple tool which plots 3D animation graphs by loading multiple data files.
How to Use
Download and Extract
At first, click the "Download" button at the above of the title of this page by your PC (not smartphone). A ZIP file will be downloaded.
Then, please extract the ZIP file. On general environment (Windows®, major Linux distributions, etc.), you can extract the ZIP file by selecting "Extract All" and so on from right-clicking menu.
» If the extraction of the downloaded ZIP file is stopped with security warning messages...
Execute this Program
Next, open the extracted folder and execute this VCSSL program.
For Windows
Double-click the following batch file to execute:
For Linux, etc.
Execute "VCSSL.jar" on the command-line terminal as follows:
java -jar VCSSL.jar
» If the error message about non-availability of "java" command is output...
How to Use After Executing the Program
Specify the folder in which data files are
After the program have been launched, select whether you want to specify the folder in which data files are or not.
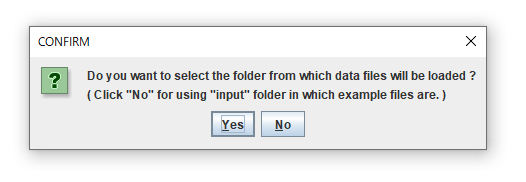
If you select "No" here, the "input" folder in this package will be used. By the default, example data files are in the "input" folder.
If you have already prepared data files in the other folder, and you want to plot them, select "YES" here, and then specify the folder by choosing it on the file-chooser window.
Input the file name and the extension
Ends of names of data files should be sequential numbers. See the following figure:
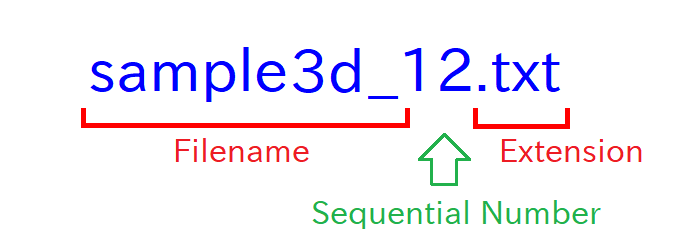
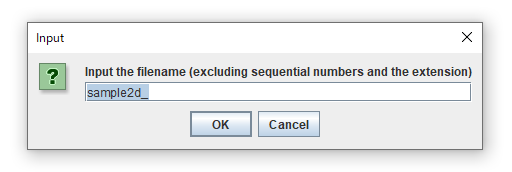
Next, input the filename of data files, excluding serial numbers and the extension, for example: "sample2d_". Then input the extension.
Many of recent PCs don't show extensions of files by default, but you can set to show it. For details, search "show file extension".
Windows and UI
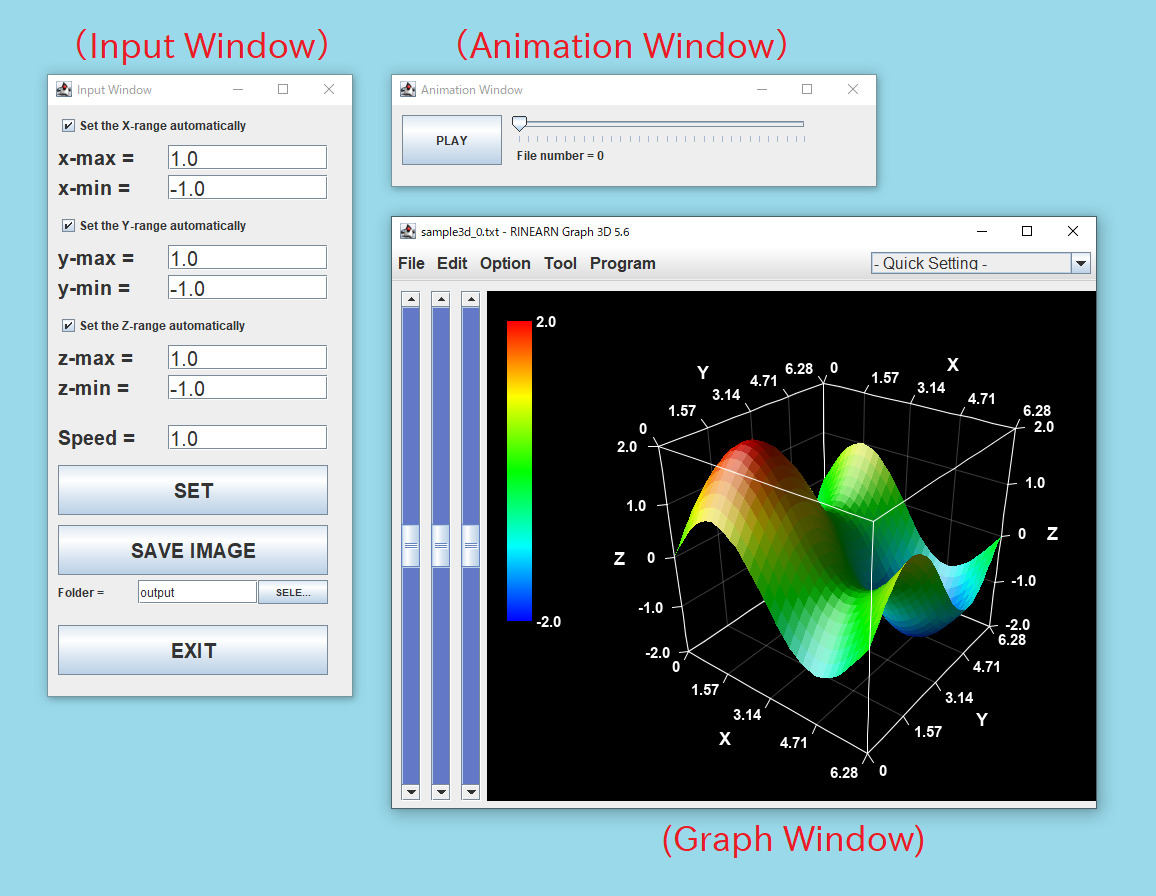
Then following three-windows will be launched. The left one is the input-window, the right-top one is animation-window, and the right-bottom one is the graph-window,
Start / Stop the Animation
Click the "PLAY" button to start the animation. The animation will be rendered by repeating fastly to plot each data file in the specified folder, in the order of sequential numbers of filenames.
When the animation is started, the label of the "PLAY" changes to "STOP". For stopping the animation, click this button again.
Save image files of graphs
You can save images of graphs as PNG-format image files by clicking "Save Image" button. By default, image files will be output in the "output" folder in this package.
Image files will be saved with filenames with sequential numbers. From them, you can create a video file or a GIF animation file by using general video-encoding/image-processing software.
Option Settings
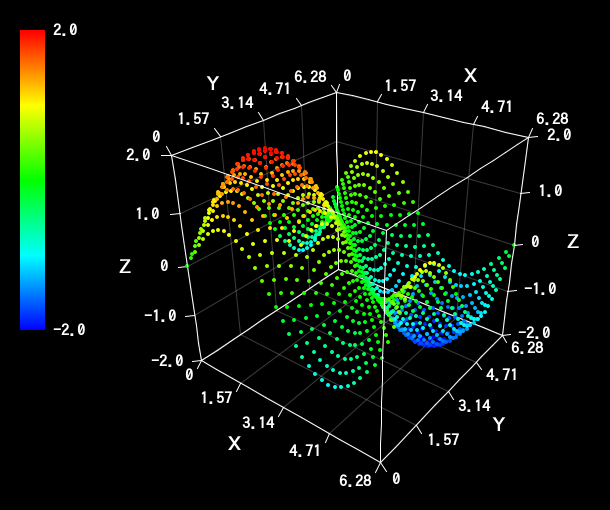
By default, the graph will be rendered by using only points:
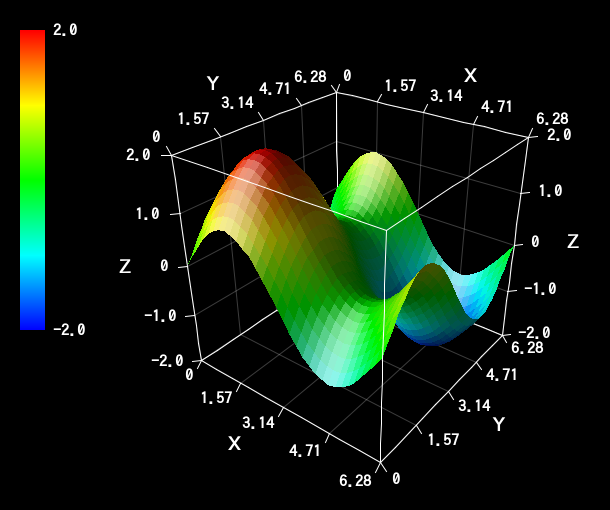
For rendering the graph as a menbrane, enable the "With Membranes" option and disable the "With Points" option, from the "Option" menu of the menu bar at the top of the graph window:
From the "Option" menu, other various plotting options are also available:
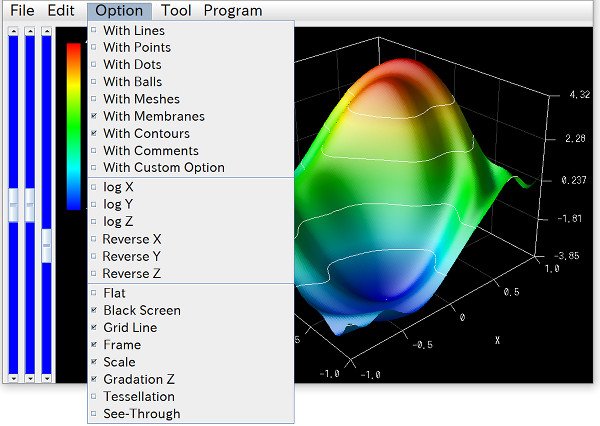
You can also modify other settings by menus on the menu bar, and can save settings by the "File" > "Save Setting" menu.
The 3D graph software "RINEARN Graph 3D" is used as the graph-window of this program. If you like UI and operability of the graph-window of this program, please try to use RINEARN Graph 3D for your data-analysis use.
» More Details
Data file formats
For details of formats of data files supported by this tool, see the manual of the RINEARN Graph 3D:
Example data files in "input" folder might help you to grasp the format of membrane/mesh data.
Code
This code is written in VCSSL.
coding Shift_JIS;

import tool.Graph3D;
import File;
import GUI;


/** The default directory from which loading data files will be loaded. */
const string DEFAULT_INPUT_DIRECTORY_PATH = "./input";

/** The default directory to which image files will be output. */
const string DEFAULT_OUTPUT_DIRECTORY_PATH = "./output";

/** The default filename to be loaded (excluding sequential numbers and the extension). */
const string DEFAULT_INPUT_FILE_NAME_HEAD = "sample3d_";

/** The default extension of data files to be loaded. */
const string DEFAULT_INPUT_FILE_EXTENTION = ".txt";

/** The default value of the maximum value of the x-range of the graph. */
const string DEFAULT_X_MAX = "1.0";

/** The default value of the minimum value of the x-range of the graph. */
const string DEFAULT_X_MIN = "-1.0";

/** The default value of the maximum value of the y-range of the graph. */
const string DEFAULT_Y_MAX = "1.0";

/** The default value of the minimum value of the y-range of the graph. */
const string DEFAULT_Y_MIN = "-1.0";

/** The default value of the maximum value of the z-range of the graph. */
const string DEFAULT_Z_MAX = "1.0";

/** The default value of the minimum value of the z-range of the graph. */
const string DEFAULT_Z_MIN = "-1.0";

/** The default value of the animation-speed. */
const string DEFAULT_ANIMATION_SPEED = "1.0";

/** The value of the animation-wait at the animation-speed = 1. */
const int BASE_ANIMATION_WAIT = 33;

/** The upper limit of sequential numbers (searched automatically from 0 to this value). */
const int FILE_NUMBER_SEARCH_LIMIT = 1000;


// Followings are variables to store the internal state.

/** Stores the directory from which loading data files will be loaded. */
string inputDirectoryPath = NULL;

/** Stores the filename to be loaded (excluding sequential numbers and the extension). */
string inputFileNameHead = NULL;

/** Stores the extension of data files to be loaded. */
string inputFileExtention = NULL;

/** Stores the beginning number of sequential numbers of filenames (searched automatically). */
int inputFileNumberBegin = -1;

/** Stores the end number of sequential numbers of filenames (searched automatically). */
int inputFileNumberEnd = -1;

/** A flag to control the continuation of the main loop (set this false to break main loop). */
bool mainLoopState = true;

/** A flag to control the state of the animation (true: playing, false: stopping). */
bool animationState = false;

/** The value of the waiting time (millisec) between each frames. */
int animationWait = (int)( BASE_ANIMATION_WAIT / (float)DEFAULT_ANIMATION_SPEED );

/**
 * The frame counter (which counts-up the number of rendered frames from the start of the animation).
 * The value of this counter varies from inputFileNumberBegin to inputFileNumberEnd.
 */
int frameCounter = 0;

/**
 * The value of the frame counter at the end of the animation.
 * This variable takes the value of: inputFileNumberEnd - inputFileNumberBegin.
 */
int frameCounterMax = -1;

/** If this flag is true, the graph will be re-plotted in the main loop, and then this flag will be turned into false. */
bool plotRequest = false;

/** The flag to perform exporting of all animation images in the main-loop. */
bool animationExportRequest = false;


// Followings are variables to store IDs of the graph and GUI components.

/** Stores the ID of the graph. */
int graph = NULL;

/** Stores the ID of the input-window. */
int inputWindow = NULL;

/** Stores the ID of the checkbox to control whether adjust the x-range automatically or not. */
int xAutoRangeBox = NULL;

/** Stores the ID of the text-field of the maximum value of x-range. */
int xMaxField = NULL;

/** Stores the ID of the text-field of the minimum value of x-range. */
int xMinField = NULL;

/** Stores the ID of the checkbox to control whether adjust the y-range automatically or not. */
int yAutoRangeBox = NULL;

/** Stores the ID of the text-field of the maximum value of y-range. */
int yMaxField = NULL;

/** Stores the ID of the text-field of the minimum value of y-range. */
int yMinField = NULL;

/** Stores the ID of the checkbox to control whether adjust the z-range automatically or not. */
int zAutoRangeBox = NULL;

/** Stores the ID of the text-field of the maximum value of z-range. */
int zMaxField = NULL;

/** Stores the ID of the text-field of the minimum value of z-range. */
int zMinField = NULL;

/** Stores the ID of the text-field of the animation speed. **/
int animationSpeedField = NULL;

/** Stores the ID of the SET button. **/
int setButton = NULL;

/** Stores the ID of the SAVE-IMAGES button. **/
int outputButton = NULL;

/** Stores the ID of the EXIT button. **/
int exitButton = NULL;

/** Stores the ID of the text-field to input the path of the folder to which image files will be output. */
int outputPathField = NULL;

/** Stores the ID of the text-field to select the folder to which image files will be output. */
int outputPathSelectButton = NULL;

/** Stores the ID of the animation-window. */
int animationWindow = NULL;

/** Stores the ID of the PLAY/STOP button. */
int animationButton = NULL;

/** Stores the ID of the time-controlling slider. */
int animationSlider = NULL;

/** Stores the ID of the time-displaying label. */
int animationLabel = NULL;


/**
 * Invoked automatically when this program have started.
 */
void main() {

	// Configure values of some variables interactive with the user.
	configure();

	// Create (or get from the system) a 3D graph window.
	graph = getGraph3D();

	// Move the graph window to the most front layer of the display.
	hideGraph3D(graph);
	showGraph3D(graph);

	// Clear the current contents of the graph.
	clearGraph3D(graph);

	// Set the location and the size of the graph window.
	setGraph3DLocation(graph, 330, 120);
	setGraph3DSize(graph, 720, 600);

	// Create the input window and the animation window.
	createInputWindow();
	createAnimationWindow();

	// Load the first data file of the animation.
	plotGraph(inputFileNumberBegin);


	// The main loop (which continues looping until the program will exit).
	while( mainLoopState ){

		if ( animationExportRequest ) {
			string outputDirectoryPath = getComponentText(outputPathField);
			if (!exists(outputDirectoryPath)) {
				alert("The specified folder \"" + outputDirectoryPath + "\" does not exist.");
			} else if (!isdir(outputDirectoryPath)) {
				alert("The specified path \"" + outputDirectoryPath + "\" is not the folder.");
			} else {
				outputDirectoryPath = getFilePath(outputDirectoryPath);
				outputImages(outputDirectoryPath);
			}
			frameCounter = 0;
			plotRequest = true;
			animationExportRequest = false;
		}

		if( animationState ){
			if( frameCounter < frameCounterMax ){
				setComponentValueInt( animationSlider, frameCounter+1 );
			}else{
				setComponentValueInt( animationSlider, 0 );
			}
		}

		if( plotRequest ){
			int fileNumber = inputFileNumberBegin + frameCounter;
			plotGraph(fileNumber);
			plotRequest = false;
		}

		sleep( animationWait );
	}

	exit();
}


/**
 * Configures values of some variables interactive with the user.
 */
void configure() {

	// Select the folder from which data files will be loaded.
	inputDirectoryPath = DEFAULT_INPUT_DIRECTORY_PATH;
	string confirmationMessage = "Do you want to select the folder from which data files will be loaded ?" + EOL + "( Click \"No\" for using \"" + DEFAULT_INPUT_DIRECTORY_PATH + "\" folder in which example files are. )";
	if (confirm(confirmationMessage)) {
		inputDirectoryPath = choose("Select the folder in which data files are", ".");
	}
	println("Input folder = " + inputDirectoryPath);

	// Input the filename of data files (excluding sequential numbers and the extension).
	inputFileNameHead = input("Input the filename (excluding sequential numbers and the extension)", DEFAULT_INPUT_FILE_NAME_HEAD);
	println("Filename = " + inputFileNameHead);

	// Input the extension of data files
	inputFileExtention = input("Input the extension of data files", DEFAULT_INPUT_FILE_EXTENTION);

	// Scan files in the folder to detect starting/end values of sequential numbers,
	// and set values of them to variables: inputFileNumberBegin and inputFileNumberEnd.
	scanFileIndex();

	// Compute the maximum value of the frame counter and set to the variable: frameCounterMax.
	frameCounterMax = inputFileNumberEnd - inputFileNumberBegin;
}


/**
 * Plots the data file of the specified number to the graph.
 */
void plotGraph(int fileNumber) {
	string fileName = inputFileNameHead + fileNumber + inputFileExtention;
	string filePath = getFilePath(fileName, inputDirectoryPath);
	setGraph3DFile(graph, filePath);
	setComponentText( animationLabel, "File number = " + fileNumber );
}


/**
 * Sets ranges of axes of the graph from the values of text fields on the input-window.
 */
void setGraphRange() {

	// Enable/disable auto ranging of each axis.
	bool xAutoRangeEnabled = getComponentValueBool(xAutoRangeBox);
	bool yAutoRangeEnabled = getComponentValueBool(yAutoRangeBox);
	bool zAutoRangeEnabled = getComponentValueBool(zAutoRangeBox);
	setGraph3DAutoRange(graph, xAutoRangeEnabled, yAutoRangeEnabled, zAutoRangeEnabled);

	// Set the range of X axis.
	if (!xAutoRangeEnabled) {
		if ( !evaluable( getComponentText( xMaxField ), 0.0 ) ) {
			alert("The value/expression of \"x-max\" is invalid.");
			return;
		}
		if ( !evaluable( getComponentText( xMinField ), 0.0 ) ) {
			alert("The value/expression of \"x-min\" is invalid.");
			return;
		}
		float xMax = feval(getComponentText( xMaxField ), 0.0);
		float xMin = feval(getComponentText( xMinField ), 0.0);
		setGraph3DRangeX(graph, xMin, xMax);
	}

	// Set the range of Y axis.
	if (!yAutoRangeEnabled) {

		if ( !evaluable( getComponentText( yMaxField ), 0.0 ) ) {
			alert("The value/expression of \"y-max\" is invalid.");
			return;
		}
		if ( !evaluable( getComponentText( yMinField ), 0.0 ) ) {
			alert("The value/expression of \"y-min\" is invalid.");
			return;
		}
		float yMax = feval(getComponentText( yMaxField ), 0.0);
		float yMin = feval(getComponentText( yMinField ), 0.0);
		setGraph3DRangeY(graph, yMin, yMax);
	}

	// Set the range of Z axis.
	if (!zAutoRangeEnabled) {
		if ( !evaluable( getComponentText( zMaxField ), 0.0 ) ) {
			alert("The value/expression of \"z-max\" is invalid.");
			return;
		}
		if ( !evaluable( getComponentText( zMinField ), 0.0 ) ) {
			alert("The value/expression of \"z-min\" is invalid.");
			return;
		}
		float zMax = feval(getComponentText( zMaxField ), 0.0);
		float zMin = feval(getComponentText( zMinField ), 0.0);
		setGraph3DRangeZ(graph, zMin, zMax);
	}
}


/**
 * Detects the beginning/end of sequential numbers by scanning data files in the folder.
 */
void scanFileIndex() {

	println("Scanning files ...");

	// Find the beginning of sequential numbers,  and set the value to: inputFileNumberBegin.
	inputFileNumberBegin = 0;
	while (true) {

		string fileName = inputFileNameHead + inputFileNumberBegin + inputFileExtention;
		string filePath = getFilePath(fileName, inputDirectoryPath);
		if (exists(filePath)) {
			println("Beginning file:" + filePath);
			break;
		}

		if(inputFileNumberBegin >= FILE_NUMBER_SEARCH_LIMIT) {
			pop("No the beginning of sequential numbers found. ( scanned from 0 to " + FILE_NUMBER_SEARCH_LIMIT + " )");
			exit();
		}

		inputFileNumberBegin++;
	}
	println("Beginning of sequential numbers = " + inputFileNumberBegin);

	// Find the end of sequential numbers, and set the value to: inputFileNumberEnd.
	inputFileNumberEnd = inputFileNumberBegin;
	while (true) {

		string fileName = inputFileNameHead + inputFileNumberEnd + inputFileExtention;
		string filePath = getFilePath(fileName, inputDirectoryPath);
		if (!exists(filePath)) {
			inputFileNumberEnd--;
			break;
		}
		inputFileNumberEnd++;
	}
	println("End of sequential numbers = " + inputFileNumberEnd);
}


/**
 * Sets the value of the animation-wait from the values of text field on the input-window.
 */
void setAnimationWait() {
	if ( !evaluable( getComponentText(animationSpeedField), 0.0 ) ) {
		alert("The value/expression of \"Speed\" is invalid.");
	}

	float speed = feval(getComponentText(animationSpeedField), 0.0);
	if (speed < 0) {
		alert("The value of \"Speed\" should not be negative.");
	}

	if (speed < 0.01) {
		alert("The value of \"Speed\" is too small.");
	}

	animationWait = BASE_ANIMATION_WAIT / speed;
}


/**
 * Sets the state of the animation (playing or stopping).
 *
 * @param state   true means playing and false means stopping.
 */
void setAnimationState( bool state ){
	animationState = state;
	if( state ){
		setComponentText( animationButton, "STOP" );
	}else{
		setComponentText( animationButton, "PLAY" );
	}
}


/**
 * Saves graphs as image files.
 *
 * @param outputDirectoryPath   the path of the folder to which image files will be saved.
 */
void outputImages(string outputDirectoryPath) {
	setComponentText(outputButton, "Saving image files ...");
	hideGraph3D(graph);
	hideComponent(animationWindow);
	hideComponent(inputWindow);
	setAnimationState(false);
	plotRequest = false;

	popup(
		"This save processing might take few minutes." + EOL +
		"Please wait without any operations after clicking \"OK\" button."
	);

	// Repeats plotting and saving for all data files.
	for (frameCounter=0; frameCounter<=frameCounterMax; frameCounter++) {
		int fileNumber = inputFileNumberBegin + frameCounter;
		plotGraph(fileNumber);
		string outputFileName = inputFileNameHead + fileNumber + ".png";
		string outputFilePath = getFilePath(outputFileName, outputDirectoryPath);
		println("Save image (" + frameCounter + "/" + frameCounterMax + "): " + outputFilePath);
		exportGraph3D(graph, outputFilePath, "PNG");
	}
	frameCounter = 0;

	showGraph3D(graph);
	showComponent(animationWindow);
	showComponent(inputWindow);

	setComponentText(outputButton, "SAVE IMAGES");
	popup("Image files have been saved to: \"" + EOL + outputDirectoryPath + "\" folder.");

	frameCounter = 0;
	setComponentValueInt( animationSlider, 0 );
}


/**
 * Creates GUI components of the input-window and launch it.
 */
void createInputWindow(){

	int leftWidth = 110;
	int rightX = leftWidth + 10;
	int rightWidth = 160;
	int buttonWidth = 270;
	int fontSize = 20;

	inputWindow = newWindow( 0, 0, 320, 630, "Input Window" );


	xAutoRangeBox = newCheckBox( 10, 10, 500, 20, "Set the X-range automatically", true );
	mountComponent( xAutoRangeBox, inputWindow );

	int xMaxLabel = newTextLabel( 10, 40, leftWidth, 25, "x-max =" );
	setComponentFontSize(xMaxLabel, fontSize);
	mountComponent( xMaxLabel, inputWindow );

	xMaxField = newTextField( rightX, 40, rightWidth, 25, DEFAULT_X_MAX );
	setComponentFontSize(xMaxField, fontSize);
	mountComponent( xMaxField, inputWindow );

	int xMinLabel = newTextLabel( 10, 70, leftWidth, 25, "x-min =" );
	setComponentFontSize(xMinLabel, fontSize);
	mountComponent( xMinLabel, inputWindow );

	xMinField = newTextField( rightX, 70, rightWidth, 25, DEFAULT_X_MIN );
	setComponentFontSize(xMinField, fontSize);
	mountComponent( xMinField, inputWindow );


	yAutoRangeBox = newCheckBox( 10, 110, 500, 20, "Set the Y-range automatically", true );
	mountComponent( yAutoRangeBox, inputWindow );


	int yMaxLabel = newTextLabel( 10, 140, leftWidth, 25, "y-max = " );
	setComponentFontSize(yMaxLabel, fontSize);
	mountComponent( yMaxLabel, inputWindow );

	yMaxField = newTextField( rightX, 140, rightWidth, 25, DEFAULT_Y_MAX );
	setComponentFontSize(yMaxField, fontSize);
	mountComponent( yMaxField, inputWindow );

	int yMinLabel = newTextLabel( 10, 170, leftWidth, 25, "y-min = " );
	setComponentFontSize(yMinLabel, fontSize);
	mountComponent( yMinLabel, inputWindow );

	yMinField = newTextField( rightX, 170, rightWidth, 25, DEFAULT_Y_MIN );
	setComponentFontSize(yMinField, fontSize);
	mountComponent( yMinField, inputWindow );


	zAutoRangeBox = newCheckBox( 10, 210, 500, 20, "Set the Z-range automatically", true );
	mountComponent( zAutoRangeBox, inputWindow );


	int zMaxLabel = newTextLabel( 10, 240, leftWidth, 25, "z-max = " );
	setComponentFontSize(zMaxLabel, fontSize);
	mountComponent( zMaxLabel, inputWindow );

	zMaxField = newTextField( rightX, 240, rightWidth, 25, DEFAULT_Z_MAX );
	setComponentFontSize(zMaxField, fontSize);
	mountComponent( zMaxField, inputWindow );

	int zMinLabel = newTextLabel( 10, 270, leftWidth, 25, "z-min = " );
	setComponentFontSize(zMinLabel, fontSize);
	mountComponent( zMinLabel, inputWindow );

	zMinField = newTextField( rightX, 270, rightWidth, 25, DEFAULT_Z_MIN );
	setComponentFontSize(zMinField, fontSize);
	mountComponent( zMinField, inputWindow );


	int animationSpeedLabel = newTextLabel( 10, 320, leftWidth, 25, "Speed =" );
	setComponentFontSize(animationSpeedLabel, fontSize);
	mountComponent( animationSpeedLabel, inputWindow );

	animationSpeedField = newTextField( rightX, 320, rightWidth, 25, DEFAULT_ANIMATION_SPEED );
	setComponentFontSize(animationSpeedField, fontSize);
	mountComponent( animationSpeedField, inputWindow );


	setButton = newButton( 10, 360, buttonWidth, 50, "SET" );
	setComponentFontSize(setButton, fontSize);
	mountComponent( setButton, inputWindow );


	outputButton = newButton( 10, 420, buttonWidth, 50, "SAVE IMAGE" );
	setComponentFontSize(outputButton, fontSize);
	mountComponent( outputButton, inputWindow );

	int outputPathLabel = newTextLabel( 10, 475, 80, 24, "Folder =");
	setComponentFontSize(outputPathLabel, 12);
	mountComponent( outputPathLabel, inputWindow );

	outputPathField  = newTextField( 90, 475, 120, 24, DEFAULT_OUTPUT_DIRECTORY_PATH);
	mountComponent( outputPathField, inputWindow );

	outputPathSelectButton = newButton( 210, 475, 70, 24, "SELECT" );
	setComponentFontSize(outputPathSelectButton, 10);
	mountComponent( outputPathSelectButton, inputWindow );


	exitButton = newButton( 10, 520, buttonWidth, 50, "EXIT" );
	setComponentFontSize(exitButton, fontSize);
	mountComponent( exitButton, inputWindow );
}


/**
 * Creates GUI components of the animation-window and launch it.
 */
void createAnimationWindow(){

	animationWindow = newWindow( 330, 0, 500, 120, "Animation Window" );

	animationButton = newButton( 10, 10, 100, 50, "PLAY" );
	mountComponent( animationButton, animationWindow );

	animationSlider = newHorizontalSlider( 120, 10, 300, 30, 0, frameCounterMax, 0 );
	mountComponent( animationSlider, animationWindow );

	animationLabel = newTextLabel( 125, 40, 300, 20, "" );
	mountComponent( animationLabel, animationWindow );
}


/**
 * Invoked when buttons are clicked (event handler).
 *
 * @param id   The ID of the clicked button.
 */
void onButtonClick( int id ){

	// Case of SET button is clicked.
	if( id == setButton ){
		setAnimationWait();
		setGraphRange();
		plotRequest = true;
		return;
	}

	// Case of EXIT button is clicked.
	if( id == exitButton ){
		mainLoopState = false;
		return;
	}

	// Case of SAVE IMAGES button is clicked.
	if( id == outputButton ){
		animationExportRequest = true;
		return;
	}

	// Case of SELECT button under the SAVE IMAGES button is clicked.
	if ( id == outputPathSelectButton ) {
		string path = choose();
		while (!isdir(path)) {
			alert("The selected filer \"" + path + "\" is not the folder.");
			path = choose();
		}
		setComponentText(outputPathField, path);
		return;
	}

	// Case of PLAY/STOP button is clicked.
	if( id == animationButton ){
		if( animationState ){
			setAnimationState( false );
		}else{
			setAnimationState( true );
		}
		return;
	}
}


/**
 * Invoked when check boxes are clicked (event handler).
 *
 * @param id   The ID of the clicked check box.
 * @param value   The current value of the clicled check box (true if selected).
 */
void onCheckBoxClick( int id, bool value ) {
	if (id == xAutoRangeBox || id == yAutoRangeBox) {
		bool xAutoRangeEnabled = getComponentValueBool(xAutoRangeBox);
		bool yAutoRangeEnabled = getComponentValueBool(yAutoRangeBox);
		bool zAutoRangeEnabled = getComponentValueBool(zAutoRangeBox);
		setGraph3DAutoRange(graph, xAutoRangeEnabled, yAutoRangeEnabled, zAutoRangeEnabled);
	}
}


/**
 * Invoked when sliders are moved (event handler).
 *
 * @param id   The ID of the moved slider.
 * @param value   The current value of the moved slider.
 */
void onSliderMove( int id, int value ){
	if( id == animationSlider ){
		frameCounter = value;
		plotRequest = true;
	}
}


/**
 * Invoked when windows are closed (event handler).
 *
 * @param   id The ID of the closed window.
 */
void onWindowClose( int id ){

	if( id == inputWindow || id == animationWindow ){
		setGraph3DAutoRange( graph, true, true, true );
		mainLoopState = false;
	}
}


/**
 * Invoked when graphs are closed (event handler).
 *
 * @param id The ID of the closed graph.
 */
void onGraph3DClose( int id ){
	if( id == graph ){
		animationState = false;
	}
}
License
This VCSSL/Vnano code (files with the ".vcssl" or ".vnano" extensions) is released under the CC0 license, effectively placing it in the public domain. If any sample code in C, C++, or Java is included in this article, it is also released under the same terms. You are free to use, modify, or repurpose it as you wish.
* The distribution folder also includes the VCSSL runtime environment, so you can run the program immediately after downloading.
The license for the runtime is included in the “License” folder.
(In short, it can be used freely for both commercial and non-commercial purposes, but the developers take no responsibility for any consequences arising from its use.)
For details on the files and licenses included in the distribution folder, please refer to "ReadMe.txt".
* The Vnano runtime environment is also available as open-source, so you can embed it in other software if needed. For more information, see here.
|
3D Graph Plotting Tool for Animating Data Loaded from Multiple Files |
|
|
|
A simple tool which plots 3D animation graphs by loading multiple data files. |
|
2D Graph Plotting Tool for Animating Data Loaded from Multiple Files |
|
|
|
A simple tool which plots 2D animation graphs by loading multiple data files. |
|
3D Graph Tool for Plotting & Animating Expressions of the Form of "z = f(x,y,t)" |
|
|
|
A simple tool which plots the expression (formula) of the form of "z = f(x,y,t)" to the 3D graph, and plays it as animation. |
|
2D Graph Tool for Plotting & Animating Expressions of the Form of "y = f(x,t)" |
|
|
|
A simple tool which plots the expression (formula) of the form of "y = f(x,t)" to the 2D graph, and plays it as animation. |
|
3D Graph Tool for Plotting & Animating Parametric Expressions of the Form of x(t), y(t), z(t) |
|
|
|
A simple tool which plots parametric expressions (formulas) of the form of x(t), y(t), z(t) to the 3D graph, and plays it as animation. |
|
2D Graph Tool for Plotting & Animating Parametric Expressions of the Form of x(t) and y(t) |
|
|
|
A simple tool which plots parametric expressions (formulas) of the form of x(t) and y(t) to the 2D graph, and plays it as animation. |
|
3D Graph Tool for Plotting Expressions of the Form of "z = f(x,y)" |
|
|
|
A simple tool which plots the expression (formula) of the form of "z = f(x,y)" to the 3D graph. |
|
2D Graph Tool for Plotting Expressions of the Form of "y = f(x)" |
|
|
|
A simple tool which plots the expression (formula) of the form of "y = f(x)" to the 2D graph. |
|
Animating a 3D Graph by Continuously Plotting Arrays (Surface/Mesh Plot) |
|
|
|
Explains how to create 3D surface/mesh graph animations by updating arrays over time. |
|
Animating a 3D Graph by Continuously Plotting Arrays (Point/Line Plot) |
|
|
|
Explains how to create 3D point/line graph animations by updating arrays over time. |
|
Animating a 2D Graph by Continuously Plotting Arrays |
|
|
|
Explains how to create 2D graph animations by updating arrays over time. |
|
Plotting Arrays on a 3D Graph (Surface/Mesh Plot) |
|
|
|
Explains how to plot coordinate data stored in an array on a 3D surface/mesh graph with sample code. |
|
Plotting a File on a 3D Graph (Surface/Mesh Plot) |
|
|
|
Explains how to plot coordinate data from a file on a 3D surface/mesh graph with sample code. |
|
Plotting Arrays on a 2D Graph |
|
|
|
Explains how to plot coordinate data stored in an array on a 2D graph with sample code. |
|
Plotting Arrays on a 3D Graph (Point/Line Graph) |
|
|
|
Explains how to plot coordinate data stored in an array on a 3D graph with sample code. |
|
Plotting a File on a 3D Graph (Point/Line Graph) |
|
|
|
Explains how to plot coordinate data from a file on a 3D graph with sample code. |
|
Plotting a File on a 2D Graph |
|
|
|
Explains how to plot coordinate data from a file on a 2D graph with sample code. |