


For details, see How to Use.
3D Graph Tool for Plotting Expressions of the Form of "z = f(x,y)"
This VCSSL program is a simple tool which plots the expression (formula) of the form of "z = f(x,y)" to the 3D graph.
How to Use
Download and Extract
At first, click the "Download" button at the above of the title of this page by your PC (not smartphone). A ZIP file will be downloaded.
Then, please extract the ZIP file. On general environment (Windows®, major Linux distributions, etc.), you can extract the ZIP file by selecting "Extract All" and so on from right-clicking menu.
» If the extraction of the downloaded ZIP file is stopped with security warning messages...
Execute this Program
Next, open the extracted folder and execute this VCSSL program.
For Windows
Double-click the following batch file to execute:
For Linux, etc.
Execute "VCSSL.jar" on the command-line terminal as follows:
java -jar VCSSL.jar
» If the error message about non-availability of "java" command is output...
How to Use After Executing the Program
Windows and UI
The following two-windows will be launched. The left one is the input-window, and the right one is the graph-window.
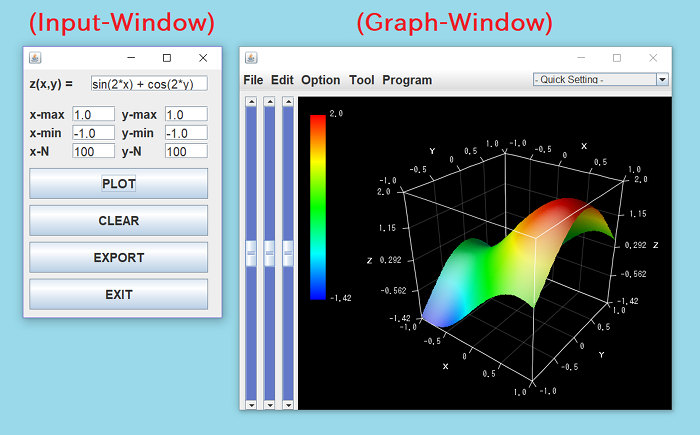
Input an Expression to Plot
At first, please input an expression you want to plot into the text field labeled with "z(x,y) =" at the top of the input-window. There are some points to write the expression:
- Use small character for "x" and "y".
- Arithmetic operations such as "+" and "-" are available. However, some symbols of operators are different with handwriting expressions. Use "*" for multiplication, and use "/" for division.
- Multiplication and division are prior in calculation order than addition and subtraction.
- You can mathmatical functions such as "sin" and "cos" in the expression. The value of circle ratio is available as "PI" (capital character).
- The exponentiation operator is "**". For example, x2 should be written as "x**2" in the expression.
Plot a Graph
After inputting the expression, please click "PLOT" button at the middle of the input-window, and the expression will be plot to the 3D graph.
The graph will be drawn as a membrane graph of "x-N" ☓ "y-N" mesh. You can modify the value of "x-N" "y-N" on the input-window. Larger value of "x-N" and "y-N" makes graph more smooth.
Plot new Expressions over the Current Graph
If you want to plot other expressions over the current graph, simply modify the expression of "z(x,y) =" text-field, and click again "PLOT" button. The new expression will be plotted over the current graph.
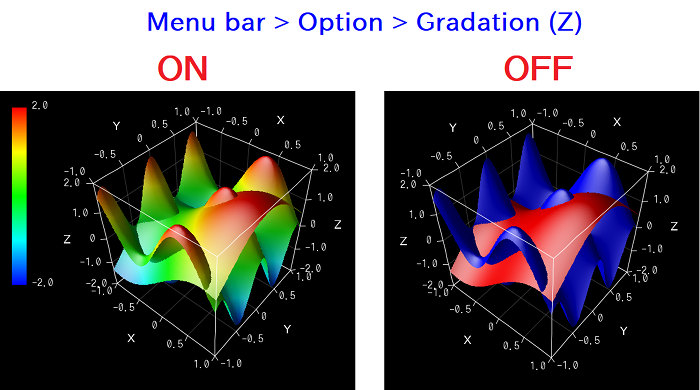
As the default settings, the graph is colored by the gradation toward z-direction, so it might be difficult to distinguish multiple membranes. In that situation, you can disable the gradation coloring mode by disabling "Gradation (Z)" checkbox from the "Option" menu at the top of the graph-window. Then the multiple each membranes will be colored by different colors as followings:
Clear All Contents of the Current Graph
If you want to clear all contents of the current graph, please click "CLEAR" button at middle of the input-window.
Other Features
If you want to change the background color to white from black, please disable "Black Screen" checkbox from the "Option" menu at the top of the graph-window. The white background is suitable for printing use, and black background is suitable for monitor of PC.
Also, if you want to plot a 3D graph as a mesh, not a menbrane, please disable "With Membranes" option and enable "With Meshes" option, from the "Option" menu on the menu bar at the top of the graph window.
You can modify other settings from "Edit" menu at the top of the graph-window, e.g. X & Y & Z ranges of the graph, labels of X & Y & Z axes, scales, light & camera, colors, etc.
You also can save settings and save the image of the current graph, from "File" menu at the top of the graph-window.
The 3D graph software "RINEARN Graph 3D" is used as the graph-window of this program. If you like UI and operability of the graph-window of this program, please try to use RINEARN Graph 3D for your data-analysis use.
» More Details
Code
This code is written in VCSSL.
coding UTF-8;

import Math;
import Text;
import GUI;
import File;
import tool.Graph3D;


/** The default value of the expression z(x,y) to plot graph */
const string DEFAULT_Z_EXPRESSION = "sin(2*x) + cos(2*y)";

/** The default value of the maximum value of the x-range of the graph. */
const string DEFAULT_X_MAX = "1.0";

/** The default value of the minimum value of the x-range of the graph. */
const string DEFAULT_X_MIN = "-1.0";

/** The default value of the number of the point toward x-direction of the mesh. */
const string DEFAULT_X_N = "80";

/** The default value of the maximum value of the y-range of the graph. */
const string DEFAULT_Y_MAX = "1.0";

/** The default value of the minimum value of the y-range of the graph. */
const string DEFAULT_Y_MIN = "-1.0";

/** The default value of the number of the point toward y-direction of the mesh. */
const string DEFAULT_Y_N = "80";


// Followings  are variables to store IDs of the graph and GUI components.

/** Stores the ID of the graph. **/
int graph = NULL;

/** Stores the ID of the input-window. **/
int window = NULL;

/** Stores the ID of the text-field of the expression z(x,y). **/
int expressionField = NULL;

/** Stores the ID of the text-field of the maximum value of x-range. **/
int xMaxField = NULL;

/** Stores the ID of the text-field of the minimum value of x-range. **/
int xMinField = NULL;

/** Stores the value of the number of the point toward x-direction of the mesh. */
int xNField = NULL;

/** Stores the ID of the text-field of the maximum value of y-range. **/
int yMaxField = NULL;

/** Stores the ID of the text-field of the minimum value of y-range. **/
int yMinField = NULL;

/** Stores the value of the number of the point toward y-direction of the mesh. */
int yNField = NULL;

/** Stores the ID of the PLOT button. **/
int plotButton = NULL;

/** Stores the ID of the CLEAR button. **/
int clearButton = NULL;

/** Stores the ID of the EXPORT button. **/
int exportButton = NULL;

/** Stores the ID of the EXIT button. **/
int exitButton = NULL;


/**
 * Invoked automatically when this program have started.
 */
void main(){

	// Set the console window invisible because it is not necessary for GUI program.
	hide();

	// Create (or get from the system) a 3D graph window.
	graph = getGraph3D();

	// Set the size and the location of the graph-window.
	setGraph3DLocation(graph, 350, 0);
	setGraph3DSize(graph, 720, 600);

	// Set options of the graph
	setGraph3DOption( graph, "WITH_POINTS", false );
	setGraph3DOption( graph, "WITH_LINES", false );
	setGraph3DOption( graph, "WITH_MEMBRANES", true );
	setGraph3DOption( graph, "WITH_MESHES", false );

	// Create and launch the input-window.
	createInputWindow();

	// If you want to read processings after when the user click PLOT button,
	// see "onButtonClick" function at near the bottom of this code.
}


/**
 * Plots the expression to the 3D graph.
 *
 * @param zExpression   The expression of z(x,y).
 * @param xMin   The minimum value of x-range.
 * @param xMax   The maximum value of x-range.
 * @param xN   The number of points toward x-direction of the mesh.
 * @param xMin   The minimum value of y-range.
 * @param xMax   The maximum value of y-range.
 * @param yN   The number of points toward y-direction of the mesh.
 */
void plotGraph( string zExpression, double xMin, double xMax, int xN, double yMin, double yMax, int yN ){

	// Arrays storing vertices data to transfer the graph.
	double xArray[yN][xN];
	double yArray[yN][xN];
	double zArray[yN][xN];

	// coordinate variables of a point.
	double x;
	double y;
	double z;

	// Check the syntax of the expression z(x,y).
	if( !evaluable(zExpression, 0.0) ){
		alert("The form of the expression of \"z(x,y)\" is wrong.");
		return;
	}

	// Store coordinate values to arrays at lattice points
	// (xN-1 and yN-1 equally divided points of the x-range and y-range)
	float dx = (xMax-xMin)/(xN-1);
	float dy = (yMax-yMin)/(yN-1);
	for( int xi=0; xi<xN; xi++ ){
		for( int yi=0; yi<yN; yi++ ){
			x = xMin + xi * dx;
			y = yMin + yi * dy;

			// Evaluate the value of z(x,y). (The second argument is an option to get the value of float type)
			z = feval( zExpression, 0.0 );

			xArray[ yi ][ xi ] = x;
			yArray[ yi ][ xi ] = y;
			zArray[ yi ][ xi ] = z;
		}
	}

	// Transfer arrays to the graph, and plot it.
	addGraph3DData( graph, xArray, yArray, zArray );
}


/**
 * Creates GUI components of the input-window and launch it.
 */
void createInputWindow(){

	int leftWidth = 100;
	int rightX = leftWidth + 10;
	int rightWidth = 190;
	int buttonWidth = 290;
	int fontSize = 20;

	window = newWindow( 0, 0, 340, 450, "Input Window" );

	int expressionLabel = newTextLabel( 10, 10, leftWidth, 25, "z(x,y) =" );
	setComponentFontSize(expressionLabel, fontSize);
	mountComponent( expressionLabel, window );

	expressionField = newTextField( rightX, 10, rightWidth, 25, DEFAULT_Z_EXPRESSION );
	setComponentFontSize(expressionField, fontSize);
	mountComponent( expressionField, window );


	int lowX = 10;
	int columnWidth = 70;

	int xMaxLabel = newTextLabel( lowX, 60, columnWidth, 25, "x-max" );
	setComponentFontSize(xMaxLabel, fontSize);
	mountComponent( xMaxLabel, window );

	xMaxField = newTextField( lowX+columnWidth, 60, columnWidth, 25, DEFAULT_X_MAX );
	setComponentFontSize(xMaxField, fontSize);
	mountComponent( xMaxField, window );

	int xMinLabel = newTextLabel( lowX, 90, columnWidth, 25, "x-min" );
	setComponentFontSize(xMinLabel, fontSize);
	mountComponent( xMinLabel, window );

	xMinField = newTextField( lowX+columnWidth, 90, columnWidth, 25, DEFAULT_X_MIN );
	setComponentFontSize(xMinField, fontSize);
	mountComponent( xMinField, window );

	int xNLabel = newTextLabel( lowX, 120, columnWidth, 25, "x-N" );
	setComponentFontSize(xNLabel, fontSize);
	mountComponent( xNLabel, window );

	xNField = newTextField( lowX+columnWidth, 120, columnWidth, 25, DEFAULT_X_N );
	setComponentFontSize(xNField, fontSize);
	mountComponent( xNField, window );


	lowX = 160;
	columnWidth = 70;

	int yMaxLabel = newTextLabel( lowX, 60, columnWidth, 25, "y-max" );
	setComponentFontSize(yMaxLabel, fontSize);
	mountComponent( yMaxLabel, window );

	yMaxField = newTextField( lowX+columnWidth, 60, columnWidth, 25, DEFAULT_Y_MAX );
	setComponentFontSize(yMaxField, fontSize);
	mountComponent( yMaxField, window );

	int yMinLabel = newTextLabel( lowX, 90, columnWidth, 25, "y-min" );
	setComponentFontSize(yMinLabel, fontSize);
	mountComponent( yMinLabel, window );

	yMinField = newTextField( lowX+columnWidth, 90, columnWidth, 25, DEFAULT_Y_MIN );
	setComponentFontSize(yMinField, fontSize);
	mountComponent( yMinField, window );

	int yNLabel = newTextLabel( lowX, 120, columnWidth, 25, "y-N" );
	setComponentFontSize(yNLabel, fontSize);
	mountComponent( yNLabel, window );

	yNField = newTextField( lowX+columnWidth, 120, columnWidth, 25, DEFAULT_Y_N );
	setComponentFontSize(yNField, fontSize);
	mountComponent( yNField, window );


	plotButton = newButton( 10, 160, buttonWidth, 50, "PLOT" );
	setComponentFontSize(plotButton, fontSize);
	mountComponent( plotButton, window );


	clearButton = newButton( 10, 220, buttonWidth, 50, "CLEAR" );
	setComponentFontSize(clearButton, fontSize);
	mountComponent( clearButton, window );

	exportButton = newButton( 10, 280, buttonWidth, 50, "EXPORT" );
	setComponentFontSize(exportButton, fontSize);
	mountComponent( exportButton, window );

	exitButton = newButton( 10, 340, buttonWidth, 50, "EXIT" );
	setComponentFontSize(exitButton, fontSize);
	mountComponent( exitButton, window );
}


/**
 * Exports data of the current graph to a file.
 */
void exportFile(){

	// Choose the file path to export.
	string exportFilePath[] = choose();
	if (length(exportFilePath) == 0) {
		return; // Case of nothing has chosen.
	}

	// If the file path has no extension, append it.
	string name = getFileName( exportFilePath[0] );
	if( indexOf(name,".") < 0 ){
		exportFilePath += ".dat3d";
	}

	// Export to a file.
	exportGraph3DData(graph, exportFilePath[0], "COLUMN_TSV");

	// Show message of completion.
	pop( "SAVED: " + exportFilePath[0] );
}


/**
 * Invoked when buttons are clicked (event handler).
 *
 * @param id   The ID of the clicked button.
 */
void onButtonClick( int id ){

	// Case of PLOT button is clicked.
	if( id == plotButton ){

		// Get the inputted expression of z(x,y).
		string zExpression = getComponentText( expressionField );

		// Check syntax of inputted contents of x-max, x-min, x-N, etc.
		if( !evaluable( getComponentText( xMaxField ), 0.0 ) ){
			alert("The form of the expression of x-max is wrong.");
			return;
		}
		if( !evaluable( getComponentText( xMinField ), 0.0 ) ){
			alert("The form of the expression of x-min is wrong.");
			return;
		}
		if( !evaluable( getComponentText( xNField ), 0.0 ) ){
			alert("The form of the expression of x-N is wrong.");
			return;
		}
		if( !evaluable( getComponentText( yMaxField ), 0.0 ) ){
			alert("The form of the expression of y-max is wrong.");
			return;
		}
		if( !evaluable( getComponentText( yMinField ), 0.0 ) ){
			alert("The form of the expression of y-min is wrong.");
			return;
		}
		if( !evaluable( getComponentText( yNField ), 0.0 ) ){
			alert("The form of the expression of y-N is wrong.");
			return;
		}

		// Evaluate values of x-max, x-min, x-N.
		double xMax = feval( getComponentText( xMaxField ), 0.0 );
		double xMin = feval( getComponentText( xMinField ), 0.0 );
		int xN = feval( getComponentText( xNField ), 0.0 );

		// Evaluate values of y-max, y-min, y-N.
		double yMax = feval( getComponentText( yMaxField ), 0.0 );
		double yMin = feval( getComponentText( yMinField ), 0.0 );
		int yN = feval( getComponentText( yNField ), 0.0 );

		// Plot the inputted expression of z(x,y) to the graph.
		// ( "plotGraph" function is declared at near the top of this program. )
		plotGraph( zExpression, xMin, xMax, xN, yMin, yMax, yN );
		return;
	}

	// Case of CLEAR button is clicked.
	if( id == clearButton ){
		clearGraph3D(graph);
		return;
	}

	// Case of EXPORT button is clicked.
	if( id == exportButton ){
		exportFile();
		return;
	}

	// Case of EXIT button is clicked.
	if( id == exitButton ){
		exit();
		return;
	}
}


/**
 * Invoked when windows are closed (event handler).
 *
 * @param id   The ID of the closed window.
 */
void onWindowClose( int id ){
	if( id == window ){
		exit();
		return;
	}
}


/**
 * Invoked when graphs are closed (event handler).
 *
 * @param id   The ID of the closed graph.
 */
void onGraph3DClose( int id ){
	if( id == graph ){
		exit();
		return;
	}
}
License
This VCSSL/Vnano code (files with the ".vcssl" or ".vnano" extensions) is released under the CC0 license, effectively placing it in the public domain. If any sample code in C, C++, or Java is included in this article, it is also released under the same terms. You are free to use, modify, or repurpose it as you wish.
* The distribution folder also includes the VCSSL runtime environment, so you can run the program immediately after downloading.
The license for the runtime is included in the “License” folder.
(In short, it can be used freely for both commercial and non-commercial purposes, but the developers take no responsibility for any consequences arising from its use.)
For details on the files and licenses included in the distribution folder, please refer to "ReadMe.txt".
* The Vnano runtime environment is also available as open-source, so you can embed it in other software if needed. For more information, see here.
|
3D Graph Plotting Tool for Animating Data Loaded from Multiple Files |
|
|
|
A simple tool which plots 3D animation graphs by loading multiple data files. |
|
2D Graph Plotting Tool for Animating Data Loaded from Multiple Files |
|
|
|
A simple tool which plots 2D animation graphs by loading multiple data files. |
|
3D Graph Tool for Plotting & Animating Expressions of the Form of "z = f(x,y,t)" |
|
|
|
A simple tool which plots the expression (formula) of the form of "z = f(x,y,t)" to the 3D graph, and plays it as animation. |
|
2D Graph Tool for Plotting & Animating Expressions of the Form of "y = f(x,t)" |
|
|
|
A simple tool which plots the expression (formula) of the form of "y = f(x,t)" to the 2D graph, and plays it as animation. |
|
3D Graph Tool for Plotting & Animating Parametric Expressions of the Form of x(t), y(t), z(t) |
|
|
|
A simple tool which plots parametric expressions (formulas) of the form of x(t), y(t), z(t) to the 3D graph, and plays it as animation. |
|
2D Graph Tool for Plotting & Animating Parametric Expressions of the Form of x(t) and y(t) |
|
|
|
A simple tool which plots parametric expressions (formulas) of the form of x(t) and y(t) to the 2D graph, and plays it as animation. |
|
3D Graph Tool for Plotting Expressions of the Form of "z = f(x,y)" |
|
|
|
A simple tool which plots the expression (formula) of the form of "z = f(x,y)" to the 3D graph. |
|
2D Graph Tool for Plotting Expressions of the Form of "y = f(x)" |
|
|
|
A simple tool which plots the expression (formula) of the form of "y = f(x)" to the 2D graph. |
|
Animating a 3D Graph by Continuously Plotting Arrays (Surface/Mesh Plot) |
|
|
|
Explains how to create 3D surface/mesh graph animations by updating arrays over time. |
|
Animating a 3D Graph by Continuously Plotting Arrays (Point/Line Plot) |
|
|
|
Explains how to create 3D point/line graph animations by updating arrays over time. |
|
Animating a 2D Graph by Continuously Plotting Arrays |
|
|
|
Explains how to create 2D graph animations by updating arrays over time. |
|
Plotting Arrays on a 3D Graph (Surface/Mesh Plot) |
|
|
|
Explains how to plot coordinate data stored in an array on a 3D surface/mesh graph with sample code. |
|
Plotting a File on a 3D Graph (Surface/Mesh Plot) |
|
|
|
Explains how to plot coordinate data from a file on a 3D surface/mesh graph with sample code. |
|
Plotting Arrays on a 2D Graph |
|
|
|
Explains how to plot coordinate data stored in an array on a 2D graph with sample code. |
|
Plotting Arrays on a 3D Graph (Point/Line Graph) |
|
|
|
Explains how to plot coordinate data stored in an array on a 3D graph with sample code. |
|
Plotting a File on a 3D Graph (Point/Line Graph) |
|
|
|
Explains how to plot coordinate data from a file on a 3D graph with sample code. |
|
Plotting a File on a 2D Graph |
|
|
|
Explains how to plot coordinate data from a file on a 2D graph with sample code. |